
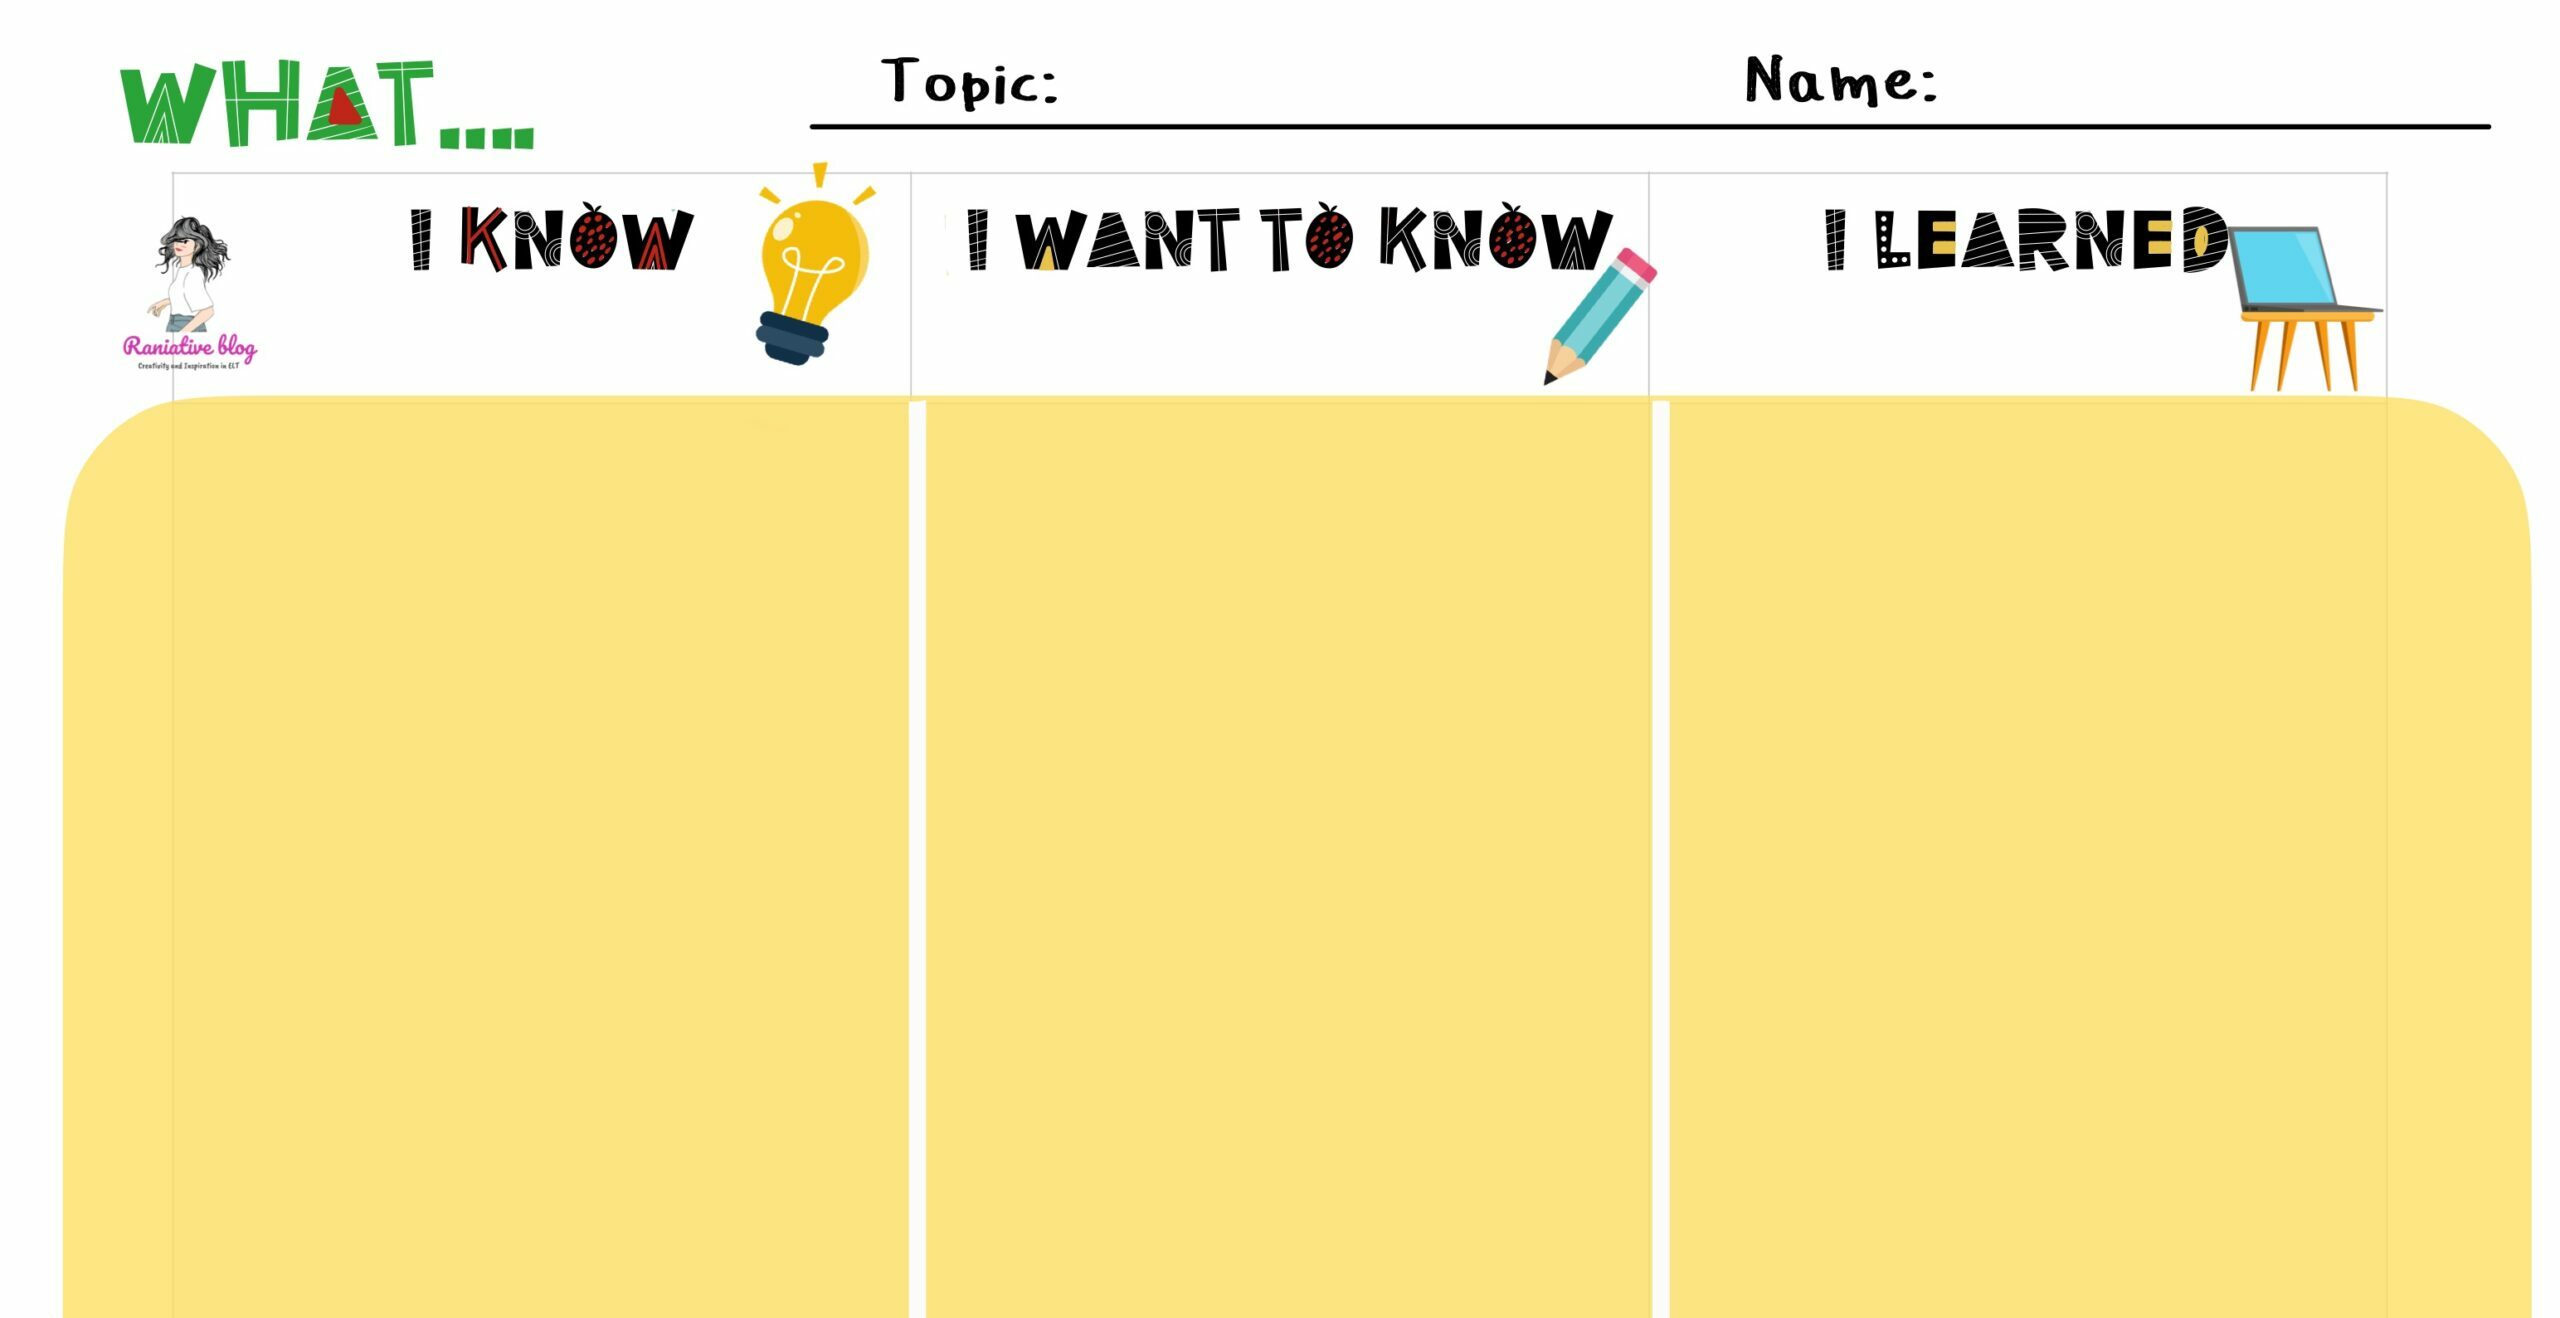
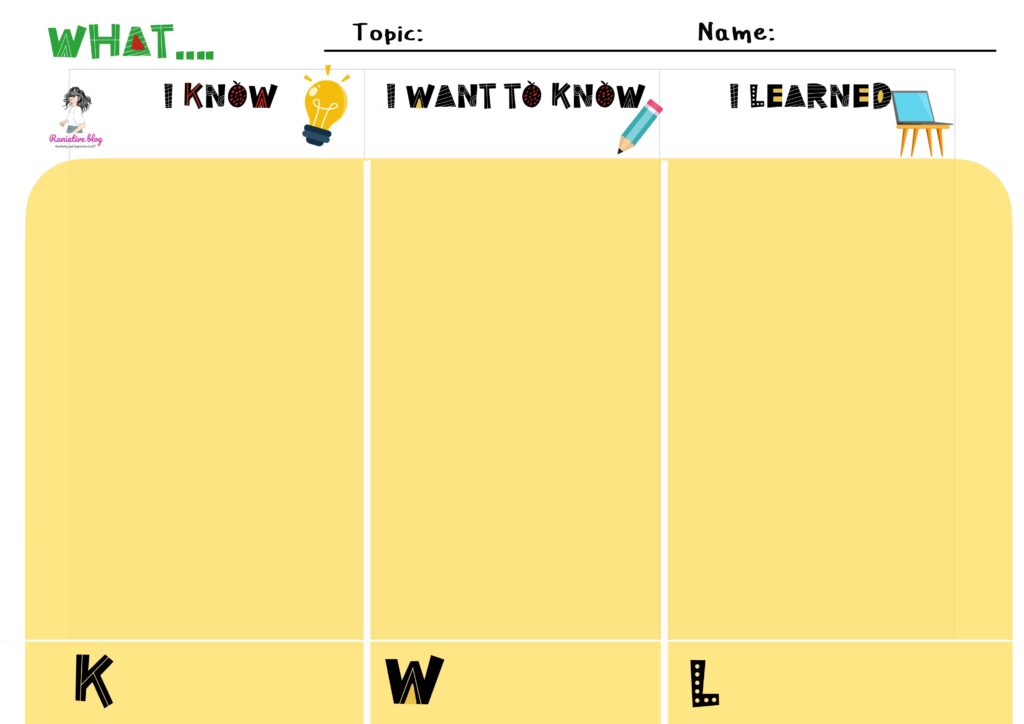
What’s a KWL chart you might wonder? Well, welcome to the club because I recently found out about them myself (a bit late to jump to the bandwagon, I know). From what I read, KWL is actually an acronym (apparently!) that stands for What I know (K), What I want to know (W) and What I learned (L). A KWL chart is nothing more than a graphic organizer that helps students monitor their learning throughout the various stages of the lesson. 
The K helps them draw on previous knowledge or make assumptions about a specific topic (misconceptions may arise, but sometimes it’s better to let the students find out for themselves if they were right about the information they initially provided).
The W can be a little tricky because some students may not know what they want to learn (rings a bell?). What you can do is write some prompt question words on the board such as Who?, What?, Where?, When? Why?. Hopefully this will get them going.
The L comes at the end of the lesson when students write about the new information they learned. Of course, now is the time to review the first and second columns to see what they got right (K) and whether their expectations were met (W).

You can assign KDL charts individually or to groups of students, since brainstorming + collaboration work like a charm in these cases! Communication + collaboration: check
The best way for me to implement those charts is during CLIL lessons, which by the way are my favourite. I have my Rosetta Stone CLIL lesson ready (you can find it here and here) and I’m really looking forward to teaching it to my 6th graders next year using this KWL chart I made!
What about you? Have you ever used KWL charts in your classroom?

